
A hockeyctack vs dreamdata multi-touch revenue attribution comparison should start with a practical question: which platform can help your team explain how marketing activity connects to pipeline and closed revenue? The platform with the longest feature list may not be the right fit. If attribution reports conflict with CRM data or sales-team experience, another dashboard won’t fix the problem unless the data and reporting approach fit your buying journey.
HockeyStack positions itself as a broader go-to-market intelligence platform, while Dreamdata is centered on B2B attribution and has expanded into go-to-market capabilities. Positioning alone doesn’t tell you which platform your team can trust, maintain, and use to make revenue decisions.
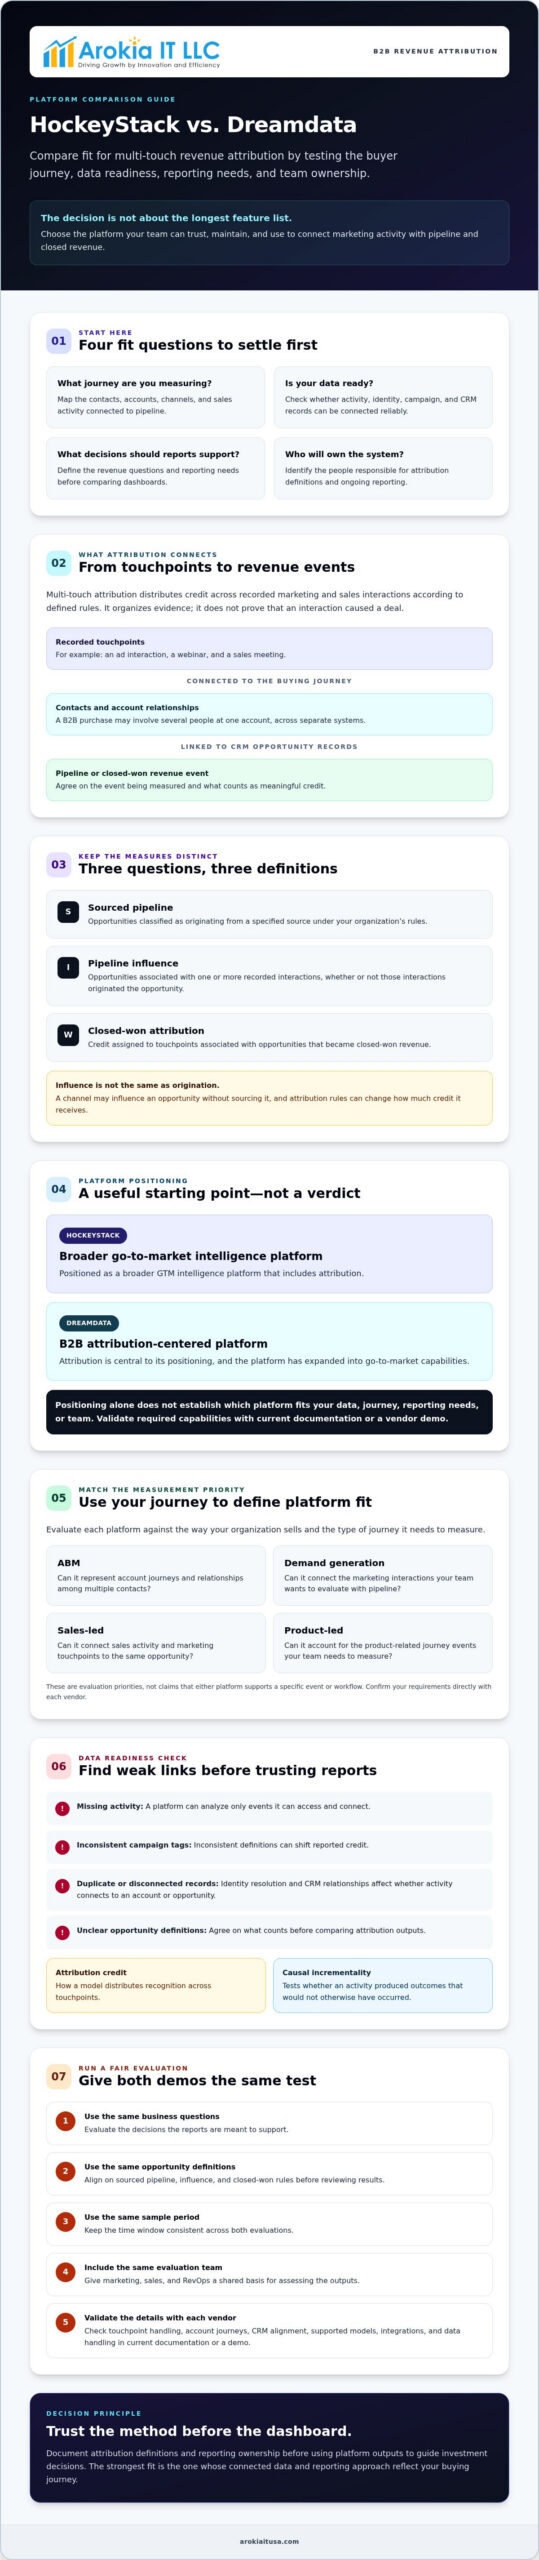
This comparison looks at practical criteria: your buyer journey, data readiness, reporting needs, and the people who will own the system. It also outlines what to validate in a demo, from how each platform handles touchpoints and account journeys to whether its outputs align with your CRM. The goal is a defensible decision, not a longer feature checklist.
Key Takeaways
- Define the buying journey you need to measure, including how contacts, accounts, channels, and sales activity relate to pipeline.
- Use the hockeyctack vs dreamdata multi-touch revenue attribution comparison to assess each platform against your data readiness, reporting needs, and revenue goals.
- Match platform fit to your measurement priorities, whether they center on ABM, demand generation, sales-led, or product-led journeys.
- Make vendor demonstrations comparable by using the same business questions, opportunity definitions, sample period, and evaluation team.
- Document attribution definitions and reporting ownership before using platform outputs to guide investment decisions.
HockeyStack vs. Dreamdata: What B2B Revenue Attribution Buyers Need to Decide
Start with the measurement question, not the feature list. Multi-touch revenue attribution assigns credit to multiple marketing and sales interactions associated with a conversion, opportunity, or revenue event. Unlike lead-source reporting, which typically records how a lead first entered the system, multi-touch attribution considers more of the journey. Unlike last-touch credit, it doesn’t assign all recognition to the final recorded interaction.
This hockeyctack vs dreamdata multi-touch revenue attribution comparison should test whether each platform’s view of the journey reflects how your organization sells. The term multi-touch attribution (MTA) describes a family of methods, not one universal formula. Before comparing reports, agree on the event being measured and what counts as meaningful credit.
What multi-touch revenue attribution measures
Attribution models distribute credit across recorded touchpoints according to defined rules. A report, for example, might assign credit to an ad interaction, a webinar, and a sales meeting connected to an opportunity. That credit organizes evidence; it does not prove that any one interaction caused the deal.
Define these terms before reviewing platform outputs:
- Sourced pipeline: Opportunities classified as originating from a specified source under your organization’s rules.
- Pipeline influence: Opportunities associated with one or more recorded interactions, whether or not those interactions originated the opportunity.
- Closed-won attribution: Credit assigned to touchpoints associated with opportunities that became closed-won revenue.
These measures answer different questions. A channel may influence an opportunity without sourcing it, and attribution rules can change how much credit that channel receives.
Why attribution comparisons are difficult in B2B
A B2B purchase may involve several people at one account, across marketing channels, sales conversations, and a long decision process. Those interactions often sit in separate systems. A contact’s website visit, a colleague’s event attendance, and a seller’s follow-up may all relate to the same opportunity, but the connection won’t be clear unless identity resolution and CRM records support it.
Missing activity, inconsistent campaign tags, duplicate records, or unclear opportunity definitions can shift reported credit. A platform can analyze only the events it can access and connect. Attribution credit describes how a model distributes recognition; causal incrementality tests whether an activity produced outcomes that wouldn’t otherwise have occurred.
Assess decision criteria, data readiness, validation questions, and use cases, not just interfaces or feature claims. Confirm product details, including supported models, integrations, and data handling, in current official documentation or a vendor demo. This gives marketing, sales, and RevOps a shared basis for judging whether reports can support pipeline decisions.
Compare HockeyStack and Dreamdata on Data, Models, and Reporting
Features matter only if the platform can connect the records your revenue team uses. For a useful hockeyctack vs dreamdata multi-touch revenue attribution comparison, assess both tools against the same CRM opportunities, campaign definitions, and revenue rules. The table separates capabilities identified in product research from details to confirm in current documentation or a vendor demonstration.
| Comparison area | HockeyStack | Dreamdata |
|---|---|---|
| Journey coverage | Confirmed: Positioned as a broader GTM intelligence platform with attribution. Verify how your required journey events are captured and connected. | Confirmed: Attribution is central to the platform, which has expanded into GTM capabilities. Verify coverage against your specific buyer journey. |
| Account and contact views | Verify with vendor: Confirm how anonymous activity, known contacts, account relationships, and opportunity records are resolved. | Verify with vendor: Confirm the same identity and account-linking rules, including how multiple buying-committee contacts appear. |
| Attribution models | Verify with vendor: Confirm currently available models and whether your team can compare them using consistent definitions. | Verify with vendor: Confirm available models, configuration options, and report-level comparisons. |
| Reporting | Confirmed: Research describes real-time data processing. Verify required account, campaign, opportunity, and revenue views in a demo. | Confirmed: Research describes batch processing, so reports may not update in real time. Verify refresh timing and required views. |
| Data movement | Confirmed: Research identifies a proprietary Atlas data foundation. Verify specific CRM, marketing automation, warehouse, and advertising connections. | Confirmed: Research identifies a warehouse-first architecture built on BigQuery and a wider range of out-of-the-box integrations. Verify your systems and data movement requirements. |
Test journey coverage and identity resolution
Ask each vendor to trace the same sample journey: anonymous site activity, a known contact’s campaign engagement, another stakeholder at the same account, an offline sales interaction, and the resulting opportunity. Check which events are matched, which remain separate, and which identity rules determine the connection. Review documented tracking methods and privacy controls; measurement and addressability remain broader industry measurement challenges.
Compare models, reports, and data movement
Use the same source records and definitions to compare sourced pipeline, influenced pipeline, and closed-won revenue. Ask vendors to show how a change in model affects the result, not just the dashboard. Confirm integrations and export or warehouse workflows directly rather than inferring availability from general platform positioning. If your team needs to align attribution with demand generation or account-based marketing decisions, discuss your measurement priorities before using platform outputs to guide budget decisions.
Which Platform Fits Your Team? Compare Use Cases and Tradeoffs
Neither platform is the automatic choice for every B2B team. HockeyStack is positioned as a broader go-to-market intelligence platform with attribution as a core component; Dreamdata is centered on attribution and has expanded into GTM capabilities. That distinction can help shape your shortlist, but the right fit depends on the workflow you need to support and the capabilities each vendor confirms for your use case.
Use this matrix to define what your team must validate in a demo. It describes measurement requirements, not guaranteed product features.
- ABM: Can the platform represent engagement across multiple contacts at a target account and connect that activity to opportunity progression? Check how its reporting handles account-level definitions when building a B2B account-based marketing strategy.
- Demand generation: Can your team group campaigns consistently and compare sourced and influenced pipeline using the definitions already used in revenue reporting?
- Sales-led: Can marketing activity, sales interactions, opportunity stages, and closed-won outcomes be reviewed together in a way sales and RevOps can validate?
- Product-led: Can each platform capture the product events that matter and relate user activity to accounts and opportunities? Verify event coverage and account-to-user relationships with both vendors.
Match the platform to your revenue motion
Start with the primary user and decision. A marketing team seeking accessible, self-serve analysis may prioritize ease of use and timely reporting. A data-centric RevOps team may place more weight on analysis depth, warehouse workflows, and control over data. Treat these as evaluation priorities, not assumptions about what either platform will deliver in your environment. Confirm relevant capabilities, data requirements, and setup responsibilities with each vendor.
Resolve tradeoffs across the buying committee
A sophisticated model has limited value if the team can’t maintain its inputs or interpret its outputs consistently. Weigh analytical depth against setup effort, user adoption, and ongoing data governance. Decide whether marketing, sales, and revenue operations need shared dashboards with common definitions or role-specific views connected to the same underlying records.
For the hockeyctack vs dreamdata multi-touch revenue attribution comparison, score both vendors against the same use cases, CRM definitions, and evaluation criteria. Don’t declare a winner based on a polished demo or feature checklist. Validate that each platform can represent your buying motion and that the people acting on its reports will use them. For a wider shortlist, consult the related article on top B2B revenue intelligence platforms.
How to Run a Fair HockeyStack vs. Dreamdata Evaluation
A fair vendor evaluation controls the inputs. If HockeyStack and Dreamdata receive different questions, records, or success criteria, the demos may look persuasive but won’t provide a reliable comparison. Create one evaluation brief with input from marketing, sales, and revenue operations, then give both vendors the same scope.
Create a controlled vendor demonstration
Set the sample period, opportunity definitions, campaign rules, and revenue fields before scheduling either demonstration. Prepare representative CRM records and campaign data, subject to your organization’s privacy and security review. If live data isn’t approved, ask each vendor what a suitable sanitized or synthetic sample should include.
Ask both vendors to trace the same account journey, from initial engagement through opportunity outcome. Choose a scenario that reflects your sales motion, such as several contacts engaging with different campaigns before a sales interaction and opportunity creation. Have each vendor explain:
- How anonymous activity, known contacts, accounts, and opportunities are matched.
- Which interactions are excluded, and why.
- How data latency and model assumptions affect the displayed results.
- Which outcomes come from standard configuration and which require additional setup.
Keep the evaluation team and business questions consistent across demos. This helps distinguish a genuine workflow difference from a presentation advantage.
Score data quality, usability, and governance
Compare evidence, not feature counts. Have evaluators use the same scale and record a reason for every rating. Score data coverage, explainability, usability, administration, and decision usefulness. For example, can the team identify why a touchpoint is missing or duplicated, understand how an attribution result was calculated, and use the report to answer a defined pipeline question?
Ask who will own campaign classification, opportunity definitions, access permissions, and ongoing data checks. Confirm role access, data retention, and security documentation with each vendor rather than assuming the controls meet your requirements. Record administrator responsibilities, user onboarding needs, and maintenance work alongside the demo results.
The hockeyctack vs dreamdata multi-touch revenue attribution comparison is useful only when both vendors are assessed against the same evidence and operating conditions. Before selecting a platform, review the scorecard with the people who will maintain the data and act on the reports. A clear process can expose adoption or governance gaps before they become reporting problems.
Turn Attribution Selection into Better B2B Revenue Decisions
The right platform fits your buyer journey, available data, internal users, and the decisions its reports are meant to inform. Neither a sophisticated model nor a broad feature set guarantees useful reporting. Before acting on attribution results, document what counts as a touchpoint, sourced pipeline, influenced pipeline, and closed-won revenue, and assign an owner to each definition.
Connect attribution outputs to accountable actions
Assign someone to review attribution reports and set a consistent review cadence. Define which decisions the reports can inform, such as where to investigate campaign performance or how to coordinate marketing and sales around target accounts. Treat findings as evidence, not a verdict. Compare them with CRM records, sales feedback, and other available performance signals before shifting investment.
Measurement becomes more actionable when it connects to coordinated execution. That may include demand generation campaigns and lead nurturing programs, with shared definitions across the teams responsible for planning and follow-up. Arokia IT LLC provides B2B demand generation as one of its marketing services.
Make the final selection defensible
Record the decision in a short evaluation summary. Include required capabilities, evidence each vendor demonstrated, unresolved questions, data dependencies, and the people responsible for administration and use. Start with an agreed reporting scope, then expand after teams can interpret the outputs and maintain the underlying definitions.
For a sound hockeyctack vs dreamdata multi-touch revenue attribution comparison, choose based on the journey a platform can represent, the data your organization can provide, the users who will rely on it, and the revenue decisions it can support. Arokia IT LLC focuses on B2B marketing strategy and execution, including account-based marketing and demand generation.
Choose the Platform Your Team Can Put to Work
The right attribution platform isn’t the one with the most features. It’s the one that can represent your buyer journey, work with your available data, and give the people responsible for revenue decisions information they can explain and use.
In your hockeyctack vs dreamdata multi-touch revenue attribution comparison, hold both vendors to the same standards: verify how they connect activity to accounts and opportunities, test reports against consistent CRM and campaign definitions, and confirm who will own data quality and reporting. Document those decisions before using attribution results to shift investment. A clear evaluation makes the selection more defensible and helps marketing, sales, and RevOps work from a shared view of pipeline.
Arokia IT LLC focuses on B2B account-based marketing and demand generation, with lead nurturing and 90-day pipeline forecasting services. These services support coordinated marketing and pipeline planning.
With clear definitions, accountable ownership, and a platform validated against your operating needs, attribution can provide a stronger foundation for revenue decisions.
Frequently Asked Questions
Is HockeyStack or Dreamdata better for multi-touch revenue attribution?
Neither platform is universally better. The right fit depends on your buyer journey, data, users, and reporting needs. In a hockeyctack vs dreamdata multi-touch revenue attribution comparison, consider HockeyStack’s broader go-to-market intelligence positioning and Dreamdata’s attribution-centered focus, then validate relevant capabilities in current documentation or demos. Compare both against the same CRM records and business definitions. Choose the platform your team can maintain and use to make defensible pipeline decisions.
What is the difference between HockeyStack and Dreamdata?
HockeyStack is positioned as a broader go-to-market intelligence platform with attribution as a component, while Dreamdata is centered on B2B attribution and has expanded into go-to-market capabilities. Research also describes differences in data architecture and processing. These distinctions can inform your shortlist, but don’t assume they determine fit. Verify current product behavior, integrations, reporting options, and implementation requirements against your company’s workflows before deciding.
Can multi-touch attribution prove that marketing caused revenue?
No. Multi-touch attribution assigns credit to recorded interactions associated with conversions, pipeline, or revenue; it doesn’t prove those interactions caused the outcome. A campaign may receive credit because it appeared in a buyer’s recorded journey, but that alone doesn’t show what would have happened without the campaign. Treat attribution as one source of evidence and weigh it alongside sales feedback and other measurement approaches when making investment decisions.
What data do HockeyStack and Dreamdata need for revenue attribution?
Requirements depend on the reports and journey coverage you need. Typically, teams should be prepared to evaluate campaign and marketing interactions, contact and account records, CRM opportunities, opportunity stages, and revenue outcomes. Confirm which data sources each platform can use, how records are matched, and what fields or campaign definitions are required. Ask vendors to demonstrate your intended use case, and have internal privacy and security teams review any sample data shared.
How should a company compare attribution models during a platform demo?
Give both vendors the same sample period, CRM records, campaign data, opportunity criteria, and revenue definitions. Ask them to show how each available model distributes credit across the same buyer journey and explain the assumptions behind the output. Note which settings are standard and which require additional configuration. Compare whether the results are understandable and useful for a real decision, not simply whether the platform offers more model options.
Is revenue attribution useful for account-based marketing?
Yes, attribution can help ABM teams examine how recorded engagement across contacts at a target account relates to opportunity progression. Its usefulness depends on whether the platform connects those contacts to the correct account and reflects the team’s campaign and opportunity definitions. Validate a representative account journey, including multiple stakeholders and sales interactions. Use the output to inform discussion and coordination, rather than treating model-assigned credit as definitive proof of impact.
What should a B2B team ask before choosing an attribution platform?
Ask whether the platform can represent your buying journey, connect anonymous and known activity to accounts and opportunities, and report on the pipeline outcomes your team cares about. Confirm integrations, model availability, data refresh timing, identity rules, privacy controls, administration needs, and ongoing ownership with each vendor. Also agree on who will review reports and how teams will validate findings. A clear evaluation scope helps prevent feature claims from substituting for evidence.